The Blue Screen of Death (commonly abbreviated as BSoD) is a type of critical error present in Microsoft Windows operating systems and ReactOS operating systems.
There are several causes that can lead to BSoD errors, such as ranging from hardware failure, unexpected crashes of crucial system processes, or even device driver incompatibilities.
One way to narrow down the list of reasons is via BSoD memory dumps (also known as kernel-mode dump files).
What Are BSoD Memory Dumps?
In simple terms, a BSoD memory dump is a file created by Windows whenever a BSoD error occurs, containing logs of what exactly happened. By locating the dump files and using a kernel debugger, users may debug the memory dump file to determine the true cause of the stop error.
How Can BSoD Memory Dumps Help You?
BSoD dump files contain information about the memory address, driver, or software module involved in the crash. This in turn can help the user identify the specific error code of their BSoD.
By providing you with the error code, you now get a better idea of what the root cause of the problem is. This allows you to better focus on that particular area (e.g., knowing that it's a driver issue). Once the problem has been identified, the dump files can help with troubleshooting the issue.
Another reason dump files are useful is that, since they're literally files, they're shareable. This makes it easier for you to collaborate with tech support regarding your particular issues, especially if the issue requires the attention of someone with more experience in the matter.
Lastly, by letting you know what the root cause of the BSoD error is, BSoD memory dumps allow you to take the necessary precautions and make the required changes to prevent BSoD errors from happening again.
The Different Types of BSoD Memory Dumps
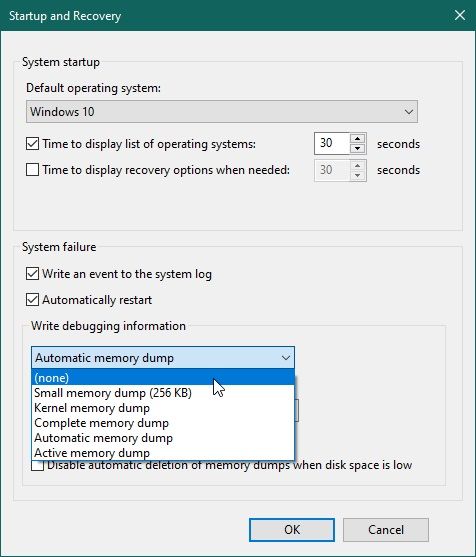
There are several kinds of BSoD memory dumps, depending on what version of Microsoft Windows you're running:
Complete Memory Dump
The largest of the kernel-mode dump files, Complete Memory Dumps contains all the physical memory used by Windows.
In order for your system to properly generate a Complete Memory Dump, you'll need to allocate a pagefile on your boot drive that's at least as big as your system memory. For example, if your PC has 16 GB of RAM, your pagefile needs to also be 16 GB, plus an additional megabyte.
Complete Memory Dump files are usually written to this location:
%SystemRoot%\Memory.dmp
One disadvantage of Complete Memory Dumps is that all subsequent Complete Memory Dumps will overwrite the previous ones. This feature was most likely implemented to help prevent filling your computer's memory with too many dump files.
Kernel Memory Dump
Unlike Complete Memory Dumps, Kernel Memory Dumps contain all the memory used by the kernel during the time of the crash. Like with the previous type of memory dump, the file size is directly correlated with the system's physical memory. However, it's usually just one-third of the size.
The reason this file is so much smaller is that these usually overlook portions of the memory that may not have had anything to do with the BSoD in the first place.
Kernel Memory Dump files are usually written to this location:
%SystemRoot%\Memory.dmp
Like with the previous dump file, whenever new Kernel Memory Dumps are generated, the previous ones will be overwritten.
Automatic Memory Dump
For all intents and purposes, Automatic Dump files are identical to Kernel Memory Dump files. However, the difference between the two is how Windows manages the system paging file.
In simple terms, you can make it so that Windows can automatically set the size of the paging file so that it will adapt to the needs of your Kernel Memory Dumps. By enabling this feature, Windows will allocate enough space so that a Kernel Memory Dump will be generated (most of the time).
However, in the event that the allocated pagefile is not enough, Windows will simply increase the size of the pagefile until it's equal to the size of the RAM on your system.
Automatic Memory Dump files are usually written to this location:
%SystemRoot%\Memory.dmp
Just like Kernel Memory Dumps, newly generated Automatic Memory Dumps will overwrite the previous ones.
Small Memory Dump
The smallest of the kernel-mode dump files, Small Memory Dumps are always limited to exactly 64 KB and require just 64 KB of pagefile.
This makes them perfect in scenarios where storage space is limited, although it comes at the cost of providing just the bare minimum of information. The lack of details provided also means that there will be situations where analyzing the dump file may not reveal what caused the BSoD error.
Small Memory Dump files are usually written to this location:
%SystemRoot%\Minidump
In the event of a new Small Memory Dump being generated, the previous file will not be overwritten. Instead, each Small Memory Dump will be given a different name that will make it easier to distinguish from one another.
Active Memory Dump
Very similar to Complete Memory Dumps, Active Memory Dumps are much smaller since they don't refer to pages that may not be the cause of the BSoD error.
These are particularly useful on Windows systems that host virtual machines since they only log the activities of the host machine, and not the virtual machines running on it.
Active Memory Dump files are usually written to this location:
%SystemRoot%\Memory.dmp Choosing the Right Memory Dump for You
There is no one-size-fits-all type of kernel-mode memory dump, as each has its own advantages and disadvantages. Basically, it's all about balancing out file size versus the usefulness of the information on that file.
For example, larger files contain more information about the BSoD error and thus provide you with the highest chance of figuring out what the underlying issue is. On the other hand, they also take longer to write, as well as analyze using a debugging tool.
Meanwhile, smaller dump files can be written and analyzed much faster, making them more desirable in conditions where you need to get your system back running as soon as possible (e.g., when running a server).
That said, you need to know the pros and cons of each type of dump file to see which one fits your needs best:
- Complete Memory Dump files take up the most disk space. However, they provide all the information that you would need to help fix your Windows issues.
- Active Memory Dump files contain almost the same information but take up less disk space.
- Automatic Memory Dumps allow your Windows system to be more flexible when it comes to using system paging file size.
- Kernel Memory Dump files are much smaller, but they may omit parts of the system logs that may actually contain helpful information.
- Small Memory Dump files are the smallest, and they don't overwrite each other because of subsequent BSoD errors.
Active Memory Dump files are only available on Windows 10 and later, while Automatic Memory Dump files are available on Windows 8 and later.
Tools for Reading and Analyzing BSoD Memory Dumps
Kernel-mode dump files exist so that users may analyze them and find out the root cause of occurring BSoD errors. Fortunately enough, there are several tools that can help with analyzing BSoD Memory Dumps:
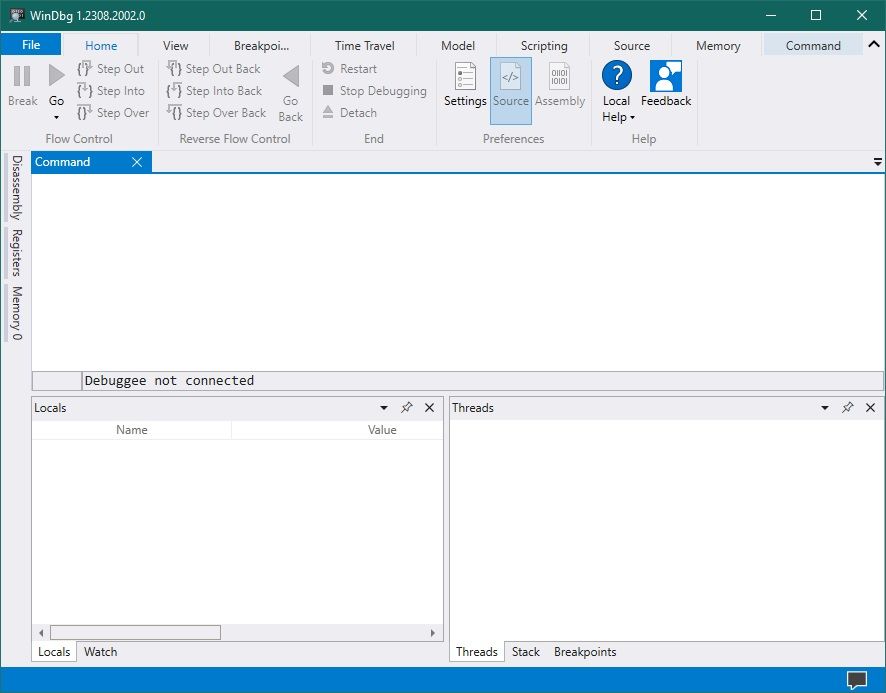
WinDbg
WinDbg is a debugging tool developed by Microsoft and designed for the Microsoft Windows operating system. Admittedly, WinDbg can help troubleshoot many Windows issues, but most users will generally analyze memory dump files with it.
While it can seem overwhelming at first, with a bit of time and patience, you too can get started with WinDbg and use it to solve most of your computer's issues.
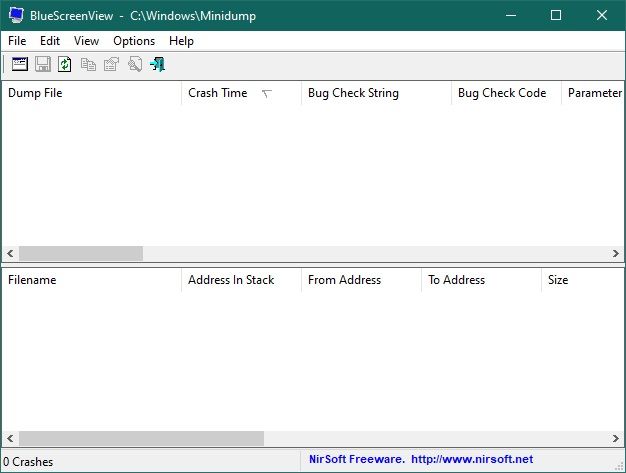
BlueScreenView
Both WinDbg and BlueScreenView can help solve BSoD errors, however, BlueScreenView is much more suitable for users who are newer to kernel debugging.
While it doesn't provide users with as much in-depth information as WinDbg, it does present the information in a much more simplistic and efficient manner.
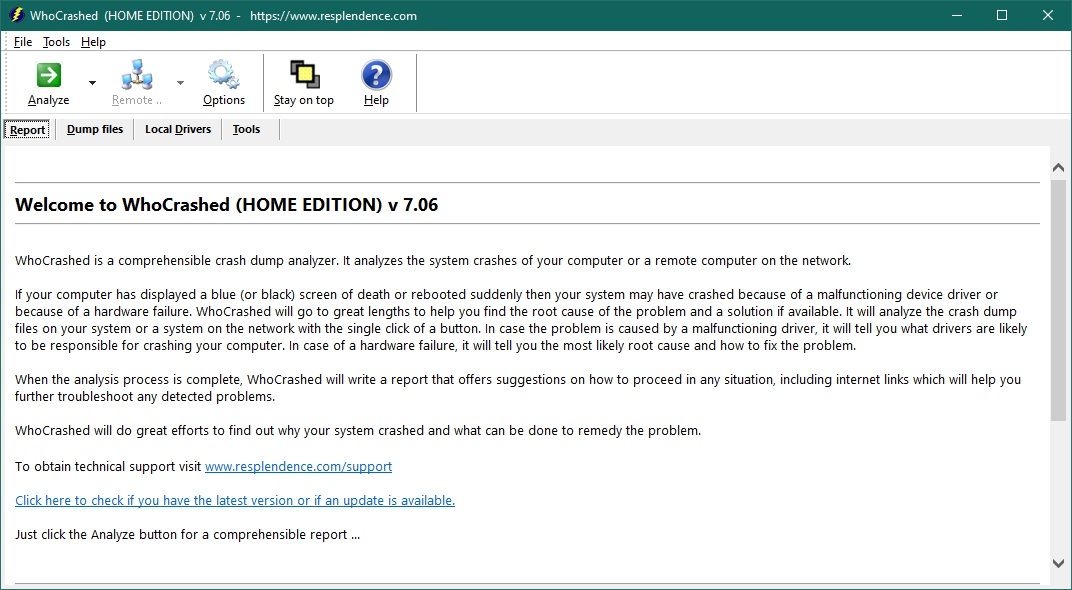
WhoCrashed
If user-friendliness is what you're looking for, then you can't get any simpler than WhoCrashed. While the interface may look dated, the information that this tool provides is more than enough to help you find the cause of BSoD errors.
The great thing about WhoCrashed is that it can even find the cause of kernel errors, which are errors that don't usually come accompanied by actual blue screens. Besides, WhoCrashed is great at finding system issues fast, especially if they happen to be driver-related.
Lastly, analyzing BSoD errors with WhoCrashed is extremely easy due to how the final analysis results are presented. In fact, in some cases WhoCrashed may even give you suggestions as to what course of action you should take.
BSoD Memory Dumps Are Great at Helping You Solve BSoD Errors
In conclusion, BSoD dump files are crucial for diagnosing, troubleshooting, and preventing system crashes.
By using the right tools and with a bit of knowledge, both casual users, and computer technicians, can detect, solve, and prevent any other BSoD errors from affecting their computer systems.


